Braving African piracy reveals abrupt rainfall shifts

Woods Hole Oceanographic Institution's Jessica Tierney has patiently produced a record of rainfall in East Africa reaching back 40,000 years, from sediment collected from pirate- and extremist-infested waters. Image copyright: Tom Kleindinst, Woods Hole Oceanographic Institution

Woods Hole Oceanographic Institution’s Jessica Tierney has patiently produced a record of rainfall in East Africa reaching back 40,000 years, from sediment collected from pirate- and extremist-infested waters. Image copyright: Tom Kleindinst, Woods Hole Oceanographic Institution

Having dodged pirates and extremists, and slogged for two years to interpret the record collected, US scientists have shown how abruptly rainy climates in East Africa come and go. Jessica Tierney puzzled out a rainfall record back to the last ice age from mud collected in one of the last research cruises to brave the Horn of Africa. “The region goes from being pretty humid to very arid in hundreds of years,” Jessica, who works at Woods Hole Oceanographic Institution (WHOI) in Massachusetts, told me. “That’s important because there’s a threshold behaviour in its rainfall. We need to better understand what drives those thresholds, and when we’d expect to be pushed over one, as it has huge implications for predicting drought and famine in the region.”

Long interested in ancient East African climate, Jessica wanted to study the Horn of Africa area, which includes Ethiopia and Somalia, because the climate there is very sensitive and variable. But its dry conditions rule out many options scientists use to build historical records from ice, cave deposits, sediments from lake beds or tree rings. So in 2010, she started working with Peter deMenocal at Lamont-Doherty Earth Observatory in New York, who collected sea bed sediments from the area in April and May 2001.

“We boarded ship in Dar Es Salaam in Tanzania and our cruise was to end in Port Said, in Egypt,” Peter told me. That took the team down the Somali coast and into the Gulf of Aden, where a few months earlier suicide bombers killed 17 sailors aboard the USS Cole. Though the scientists were worried, the captain of their Dutch research ship, R/V Pelagia was vigilant. “He had ordered radio silence, and we actually turned off all our lights on the ship at night, even navigation lights,” Peter recalled. “He had also put in orders for us to train on what to do in case we were boarded.”

Read the rest of this entry »

Deciphering climate messages via the heart of the atom

Vemork Hydroelectric Plant at Rjukan, Norway, which Hans Suess advised on heavy water production, telling Nazi Germany it couldn't make heavy water quickly enough for military use. His expertise with heavy water was part of an interest in nuclear science that led him to become a pioneer in carbon dating.

Vemork Hydroelectric Plant at Rjukan, Norway, which Hans Suess advised on heavy water production, telling Nazi Germany it couldn’t make heavy water quickly enough for military use. His expertise with heavy water was part of an interest in nuclear science that led him to become a pioneer in carbon dating.

When Hans Suess chose to study physical chemistry, he went nuclear, apparently overturning two generations of family tradition. Hans was born in 1909, just as his father Franz succeeded his grandfather Eduard as a geology professor at the University of Vienna. Hans got his PhD from the same university in 1936, but in studying heavy water he was set to aid the historic advances in nuclear science of the time. Yet a transatlantic scientific coincidence would bring him back to more environmental science, and see him help pioneer radiocarbon measurements. With that expertise, Hans showed humans were raising atmospheric CO2 levels, and revealed another surprising source of variations in climate.

The common theme to these achievements was how neutrons and protons combine in an atom’s nucleus. For example, hydrogen atoms found in conventional water have just a single proton in their nuclei. In heavy water, some of these atoms are replaced by a rarer form of hydrogen, known as deuterium, whose atoms have an extra neutron in their nuclei. That gives heavy water properties that can help nuclear reactors, which Nazi Germany notoriously hoped to exploit to make nuclear weapons.

With Hitler’s armies occupying Austria just two years after Hans finished his PhD, his expertise brought him to the attention of the Nazi regime. They called him in to advise a hydroelectric power plant in Vemork, Norway, that was making heavy water. Hans visited several times, reporting that it couldn’t make heavy water quickly enough for military use. Allied forces destroyed it in 1943 anyway, in audacious raids fictionalised in the film “Heroes of Telemark”.

Alongside working with heavy water, Hans studied why the chemical elements exist in the amounts that they do. The answer laid in how stable different numbers of protons and neutrons are when they come together in nuclei. He continued this work after the Second World War in West Germany, helping develop the “Nuclear Shell Theory” explanation, which other scientists won the Nobel Prize for Physics for in 1963. Suess missed out on this acclaim partly because two teams came up with the explanation at the same time. But when the other team, based at the University of Chicago, invited him to visit, Hans’ life changed course towards unravelling the secrets of Earth’s history. Read the rest of this entry »

Projected warming set to exceed civilisation’s experience

Oregon State University's Shaun Marcott has built a climate record reaching back 11,300 years, showing that today's temperatures are warmer than at least 70% of that period. Credit: Shaun Marcott

Oregon State University’s Shaun Marcott has built a climate record reaching back 11,300 years, showing that today’s temperatures are warmer than at least 70% of that period. Credit: Shaun Marcott

The world is headed for average surface temperatures warmer than it has seen in at least 11,300 years. That’s one conclusion US researchers have reached after bringing together 73 studies of ancient climate from across the world into a single global record. Their work supports previous records for the past 2,000 years built mainly from tree ring data, explained Shaun Marcott from Oregon State University, and gives a much broader view.

“We can put today’s global temperature into context against the entire Holocene period,” Shaun told me. “That’s when human civilisation was born, developed and progressed to today.” Modern temperatures are higher than in around three-quarters of that period, which reaches back to the end of the last ice age. And their comparison against forecasts for 2100 made in models used by the Intergovernmental Panel on Climate Change (IPCC) is even starker. “If those scenarios come to fruition, we’ll be well outside anything human civilisation has seen,” Shaun warned. “We won’t have even have been close.”

Knowing climate’s history helps understand its present, and so researchers have puzzled out temperatures on the Earth’s surface from proxy, or indirect, records for the last 2,000 years. In particular, bringing together measurements from tree rings, ice and coral has showed a sharp recent temperature rise often referred to as the ‘hockey stick’. Meanwhile, studies scattered across the world had reached back across the 11,300 years since the beginning of the Holocene. But they can be influenced by regional effects, and no one had pieced them into a global view that would overcome that. Read the rest of this entry »

Continued emission growth promises US megadroughts

Pinyon pine forests that usually absorb CO2 from the atmosphere to grow near Los Alamos, N.M., in the region Christopher Schwalm and his colleagues studied, had already begun to turn brown from drought stress in the image at left, in 2002, and another photo taken in 2004 from the same vantage point, at right, show them largely grey and dead. Credit: Craig Allen, U.S. Geological Survey

Pinyon pine forests that usually absorb CO2 from the atmosphere to grow near Los Alamos, N.M., in the region Christopher Schwalm and his colleagues studied, had already begun to turn brown from drought stress in the image at left, in 2002, and another photo taken in 2004 from the same vantage point, at right, show them largely grey and dead. Credit: Craig Allen, U.S. Geological Survey

Though the last time western North America saw a drought as severe as the one it experienced in 2000-2004 was 800 years ago, such conditions could become normal by the end of the century. This drying will shift western North America’s natural carbon cycle into reverse, from absorbing CO2 overall today to emitting it and worsening climate change further. That’s according to a paper by Christopher Schwalm, from Northern Arizona University in Flagstaff, and his colleagues published in the research journal Nature Geoscience on Sunday. “What we now call a drought event will become an abnormally wet episode by the end of the 21st Century,” Christopher told Simple Climate.

With drought in the US Midwest currently drawing much attention, the 2000-2004 drought might have slipped from some memories – even though they led to a natural disaster being declared in some areas. Our views of these events are bound to change as droughts become more regular as the world heats up, even though warmer air can contain more water vapour. “The changing climate means that the atmosphere can carry more water,” Christopher said. “However, precipitation will happen in spurts, more intensive rainfall in a relatively short period of time. Similarly, the amount of time between such events is expected to increase. So we will see fewer but more intense rainfall events, and therefore more droughts.”

The “turn of the century” drought has been remembered and closely studied by researchers looking at what it tells us about our climate. However, that research hasn’t been brought together to understand what it means for how much carbon plants are taking up, Christopher said. So he set out with a team of nine other US and Canada-based researchers to fill that gap. But to do so meant working with several sets of measurements that covered different areas and time periods. “Despite having various satellite data sources, global monitoring networks, and the like, our biggest challenge was how to piece together what data we do have and still paint a comprehensive picture,” Christopher explained. Read the rest of this entry »

Volcano cloud over tree-ring temperatures clears

Pennsylvania State University's Michael Mann thinks he has found the reason behind key outstanding disagreements between the historical temperature record based on tree rings and climate models for the same period. Credit: Pennylvania State University

Pennsylvania State University’s Michael Mann thinks he has found the reason behind key outstanding disagreements between the historical temperature record based on tree rings and climate models for the same period. Credit: Pennylvania State University

The sudden chills violent volcano eruptions cast over the world centuries ago effectively erased themselves from the historical climate record produced by examining tree-rings. So suggests a team led by Michael Mann from Pennsylvania State University, who famously used 1,000 years of tree-ring measurements in the “hockey stick” graph showing how unusual today’s temperatures are. Michael warns the skipped years could affect scientists’ estimates of how much the world warms in response to greenhouse gases in the atmosphere, known as its climate sensitivity. But other than the volcano years, the scientist notes that tree-ring data is a remarkably accurate match with the climate models they used for comparison. “Interestingly, the effect has little influence on long-term trends, including conclusions about how previous temperatures compares to modern ones,” he told me. “Instead, it appears only to have implications for how strong past short-term cooling events were.”

A tree’s age can usually be told from the rings that form across its trunk representing each year’s growth. How thick each ring is shows how much the tree grew in the year in question, which is influenced by the temperatures that tree experienced. That means examining the thickness of rings in old trees can provide a way to tell temperatures back through history. Many challenges have already been overcome in turning this simple-sounding idea into a history of the world’s temperature, but Michael was still troubled by one particular detail. Read the rest of this entry »

Climate benefit from trees depends on location

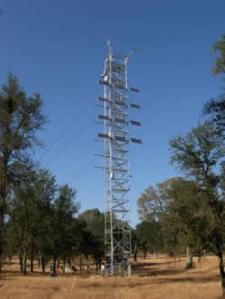
By comparing forest temperature measurements from Fluxnet towers, like this one in Tonzi Ranch, California (not actually used in this study), with nearby weather stations in grassy fields, Xuhei Lee and his colleagues could determine the warming or cooling effect of forests. Credit: Dennis Baldocchi

By comparing forest temperature measurements from Fluxnet towers, like this one in Tonzi Ranch, California (not actually used in this study), with nearby weather stations in grassy fields, Xuhei Lee and his colleagues could determine the warming or cooling effect of forests. Credit: Dennis Baldocchi

Trees growing near the equator can directly cool local temperatures, while those nearer the poles can have a direct warming effect. That’s according to a team of 21 scientists from Germany, Canada and the US who have compared temperatures in North American forests with those in nearby open areas. Snow covered open land reflects sunlight back into space in the day, and cools further at night. Trees in such environments, meanwhile, absorb light in daytime and help trap heat near the ground at night. By contrast, in warmer areas, trees’ large, rough, surface area releases heat into the atmosphere more efficiently than open land. This direct effect operates separately to the role trees play in climate by absorbing CO2, but does contribute to their overall influence on world temperatures.

“It reinforces the notion that the benefit of tree planting depends on where you do it,” lead scientist Xuhui Lee from Yale University told Simple Climate. “Our data suggest that planting is beneficial south of 35 degrees north [the distance between the North Pole and North Africa, North Carolina or Tibet] and may be counterproductive north of that.” Another implication comes because weather stations are supposed to be located away from objects like buildings and trees that absorb and release heat. Consequently, the same effect could also influence global temperature records that we rely on to monitor climate change like the one produced by NASA’s Goddard Institute for Space Studies. Lee said that though this might affect some local measurements, the overall historical records should be correct. He is more worried by what locating weather stations only outside forests does to the measured difference between the daily maximum and minimum temperature, known as the diurnal temperature range or DTR. “Our results show that DTR could be off by as much as 8ºC in some locations,” Lee said. Read the rest of this entry »

Tension simmers over climate link to plant growth

A misty canopy at dawn in the Amazon forest, where calculations of plant growth from satellite measurements that differ from direct measurements have come under criticism. Image courtesy of Peter van der Steen

A misty canopy at dawn in the Amazon forest, where calculations of plant growth from satellite measurements that differ from direct measurements have come under criticism. Image courtesy of Peter van der Steen

A surprise finding that plants are growing less quickly when, with current temperatures and CO2 levels, we might expect the opposite has come under fire from two independent groups of scientists. In August 2010, Maosheng Zhao and Steven Running from the University of Montana, Missoula showed that a measure of plant growth speed had slowed slightly since 2000. That’s even though it had accelerated in the 1980s and 1990s, a situation that fits the higher levels of CO2 in the atmosphere available to help plants grow through photosynthesis. But now, a year later, scientists from the US and Brazil have complained that this does not match what they’ve seen directly in Amazonian forests. Meanwhile, an Australian scientist adds to these objections with claims that Zhao and Running have over-estimated the effect that temperature has had on growth rates.

The disagreement focuses on how Zhao and Running calculated the measure of plant growth they use – net primary productivity (NPP) – from satellite data. “Measuring growth of a single tree is easy, however, at the global level, for billions of trees and plants, measurement of growth is only possible with data from satellites,” Zhao told Simple Climate. “Our model uses vegetation greenness information observed from satellites and daily global weather data to calculate vegetation growth of each kilometre over 110 million square kilometres of vegetated land surface.” The downside in this approach is that the view of Earth’s surface is often blocked, for instance by clouds and smoke. When that happens, the Montana researchers use the data from before and after the days the satellite can’t see the surface to fill in the missing measurements. They can then calculate NPP from those vegetation greenness measurements.   Read the rest of this entry »

Warming puts species at one in ten extinction risk by 2100

While Ilya Maclean and Robert Wilson found that measurements backed up predictions of climate change's impact on plants and animals, there were few studies in the tropics. Those that were investigated Mexican trees, like those shown here. Credit: Arturo Avila/Flickr

While Ilya Maclean and Robert Wilson found that measurements backed up predictions of climate change's impact on plants and animals, there were few studies in the tropics. Those that were investigated Mexican trees, like those shown here. Credit: Arturo Avila/Flickr

Climate change’s recent impact on Earth’s life has backed up previous assessments calling it “one of the major threats to global biodiversity”. Ilya Maclean and Robert Wilson at the University of Exeter, UK, compared predictions of warming’s effects on species since 2005 and actual measurements made in that time. Both predictions and observations gave an average extinction risk across all species by 2100 close to one in ten. “I was dismayed by the magnitude of potential extinctions that could occur, but was also relieved that we were able to show that scientific predictions were, on the whole, accurate,” Maclean told Simple Climate.

Individual studies on climate’s effects on species inevitably give a limited picture as they typically only focus on a few plants or animals at one time. Similarly, scientists’ predictions of the likely impacts of climate change are often met with scepticism. Maclean and Wilson therefore sought to bring prediction and measurements across different species together to address both issues. They gathered together data from 74 studies published since 2005, comparing their findings against well-established methods of judging extinction threats. 42 of these were predicting extinctions, movements of and changes in species’ populations, while 32 had recorded details of the actual responses to recent changes. Read the rest of this entry »

Chinese pollution postpones temperature rises

Sulphur emissions, which contribute to acid rain that can damage soil, plants and trees like these, have also slowed temperature rise between 1998 and 2008 compared to last quarter of the 20th Century. Credit: Wikimedia Commons

Sulphur emissions, which contribute to acid rain that can damage soil, plants and trees like these, have also slowed temperature rise between 1998 and 2008 from the more rapid warming seen between the mid-70s and mid-90s. Credit: Wikimedia Commons

The full climate impact of China’s massive industrialisation between 1998 and 2008 has yet to be felt, thanks to its reliance on coal, US and Finland-based researchers said this week. Using this fuel for energy generation did release large volumes of the greenhouse gas CO2 that will warm the planet in the long term. However, it also emitted pollutants derived from the element sulphur that oppose this warming effect in the short term, explained Boston University’s Robert Kaufmann. “That let natural variations in that decade really predominate,” Kaufmann told Simple Climate.

These findings help answer a long-standing climate question, which stumped Kaufmann when he was speaking about global warming to the public in New Jersey in 2008. “A member of the audience said that he had heard that global temperatures hadn’t risen for about 10 years,” the researcher explained. “He asked me why not, and I must admit that I was at a loss to explain it.” Climate scientists have conceded that there has technically been no warming in this time, even though the US National Oceanographic and Atmospheric Administration (NOAA) said 2005 was then the warmest year on record. Kaufmann found that in fact there hadn’t yet been any satisfactory explanation why this had happened, partly due to the tools used by climate scientists. Most “general circulation” models (GCMs) used to simulate processes in the atmosphere and on the Earth calculate climate patterns from the laws of physics. While these are good at modelling changes in the long term, they are much less accurate over periods of just a few years, Kaufmann said. Read the rest of this entry »

Native tip-off reveals unmatched Arctic storm surge

Dead vegetation killed by a 1999 storm surge in the Mackenzie Delta is in stark contrast to the vegetation along the edges of waterways that receive regular freshwater (and thus survived the damage). Credit: Trevor Lantz, University of Victoria

Dead vegetation killed by a 1999 storm surge in the Mackenzie Delta is in stark contrast to the vegetation along the edges of waterways that receive regular freshwater (and thus survived the damage). Credit: Trevor Lantz, University of Victoria

Plants and animals living along the coast of the Mackenzie Delta in the Canadian Arctic have been devastated by a salt-water flood, made more severe by climate change. After local Inuvialuit natives told them that where they could hunt had changed, Canadian scientists showed the damage was unrivalled during the period they could document by studying tree rings and lake sediments. “The impacts of this storm were truly unique in the last millennium,” commented biologist John Smol of Queen’s University in Kingston, Ontario.

“The Inuvialuit brought to our attention the occurrence of a large storm surge that happened in late September 1999,” said Joshua Thienpont, a postgraduate student at Queen’s. “The region was frequented by members of the local communities to hunt waterfowl that would nest near the delta front. The Inuvialuit hunters noted that, after the storm, birds no longer nested there.” At that point, however, it wasn’t clear how common such events were, so Smol, Thienpont, and their colleagues exploited the nearby “natural archives” to try and find out. One such record of previous surges came because they thought that plants not used to being covered in saltwater would grow less quickly when under the flood waters. “With this in mind, we sampled alder shrubs and measured their growth rings using a microscope and specialized measuring system,” said Michael Pisaric, a geographer at Ottawa’s Carleton University. Read the rest of this entry »